

Table of Contents


TRL Krosaki Unlisted Shares
BUY
₹ 1,610.00
SELL
₹ 1,775.00
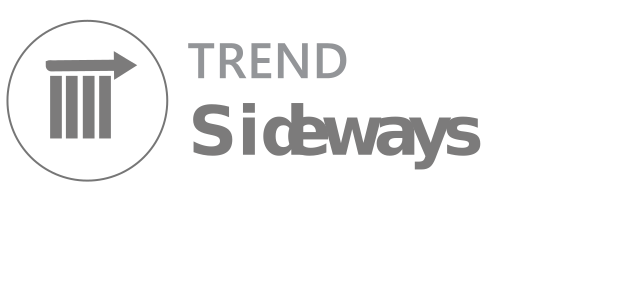
TRL Krosaki shares are likely in a sideways trend due to a combination of factors including foreign competition, raw material price fluctuations, and the company's strategy to mitigate these risks.
As on 31 Jul 2026, 12:37 AM, we are buying shares of the TRL Krosaki Refractories Limited for ₹ 1,610.00 and selling them for ₹ 1,775.00 per share.
About TRL Krosaki Unlisted Shares
TRL Krosaki Refractories Limited (formerly Tata Refractories Limited) was established in 1958 as Belpahar Refractories Limited in Jharsuguda, Odisha. Over the years, it has become a leader in the refractories industry, serving sectors like steel, aluminum, and copper. The company was renamed Tata Refractories in 1986 and later, in partnership with Krosaki Harima Corporation (KHC) from Japan, it evolved into TRL Krosaki. Today, TRL Krosaki is India’s leading refractories manufacturer, and the company ranks as the 4th largest refractories manufacturer globally.
Read more
With a wide range of refractories products and services, TRL Krosaki caters to the industrial needs of several key sectors, including steel, cement, copper, aluminum, and power. It operates multiple state-of-the-art manufacturing plants across India and China, ensuring global reach and an extensive product portfolio.
Business Divisions
TRL Krosaki operates in multiple business segments that cater to the needs of industries that require high-performance refractories:
- Refractories Production: TRL Krosaki manufactures a variety of refractories used in different industrial processes. Its key products include:
- Basic Refractories
- Dolomite Refractories
- High Alumina Refractories
- Monolithic Refractories
- Silica Refractories
- Taphole Clay
- RH Snorkel Refractories
- Refractories Management and Technical Services: TRL Krosaki provides specialized technical services that include:
- Refractories Management Services for optimizing the lifespan of refractories in operational settings.
- Refractories Engineering Services to support industrial clients in designing and managing refractory systems.
- Technical Support Services to offer expert guidance for maintaining refractory systems in critical applications.
- Global Manufacturing and Supply Network: TRL Krosaki operates several plants in India and abroad, including:
- Belpahar Plant (Odisha) - Focuses on basic, dolomite, and high alumina refractories.
- Salem Plant (Tamil Nadu) - Specializes in basic ramming mass and tundish spray mass.
- China Plant - Manufactures mag-c and AMC bricks for the Chinese market.
- Strategic Global Partnerships: TRL Krosaki's strategic partnership with Krosaki Harima Corporation (KHC), a global leader in refractories, has strengthened the company’s position in the market. With KHC owning 77.62% of TRL Krosaki’s shares, the company has access to cutting-edge technology and global best practices.
Financial Highlights
Here are the key financial highlights of TRL Krosaki Unlisted Shares:
- Revenue Growth: TRL Krosaki reported revenue of ₹2,503 crore in FY2024, a 9.1% increase from ₹2,295 crore in FY2023. This growth is driven by higher demand for refractories and strong global sales, especially in steel and copper industries.
- Profitability Improvement: The company posted EBITDA of ₹318 crore in FY2024, reflecting a 20% increase compared to ₹264.63 crore in FY2023. Its operating profit margin (OPM) improved to 12.7% in FY2024, up from 11.53% in FY2023, indicating better cost management and operational efficiency.
- Strong Net Profit Growth: TRL Krosaki’s net profit (PAT) surged by 53% to ₹243 crore in FY2024, compared to ₹158.27 crore in FY2023. This was driven by higher revenue, efficient cost management, and favorable demand dynamics in the global refractories market.
- Earnings Per Share (EPS) Growth: The EPS for FY2024 increased to ₹116.27, up from ₹75.73 in FY2023. This increase reflects the company’s strong earnings growth and the value it provides to shareholders.
- Solid Asset Base: The company’s total assets grew to ₹1,569 crore in FY2024, from ₹1,427 crore in FY2023, driven by investments in new plant capacities and technology upgrades. Fixed assets increased to ₹531 crore, reflecting the company’s expanding manufacturing capabilities.
Pros
- Stock is trading at 1.14 times its book value
- Company is expected to give good quarter
- Company has been maintaining a healthy dividend payout of 26.3%
Cons
- Company has low interest coverage ratio.
- The company has delivered a poor sales growth of -6.23% over past five years.
- Company has a low return on equity of 3.68% over last 3 years.
Key Details
| Share Name | Particulars |
|---|---|
| TRL Krosaki Unlisted | 1750.00 |
| Shares Price | Per Equity Share |
| Minimum Lot Size | Shares Worth Rs. 50000 |
| 52 Week High | ₹ 1950 |
| 52 Week LoW | ₹ 1625 |
| Depository | NSDL |
| PAN Number | AAACT6494Q |
| ISIN Number | INE012L01014 |
| CIN | U26921OR1958PLC000349 |
| RTA | Universal Capital Securities |
| Fundamentals | Value |
|---|---|
| Market Cap (in cr.) | 3657.50 |
| P/E Ratio | 10.64 |
| P/B Ratio | 3.04 |
| Debt to Equity | 0.09 |
| ROE (%) | 29% |
| Book Value | 575.62 |
| EPS | 164.42 |
| Face Value | 10 |
| Total Shares | 20900000 |
Financials
| P&L Statement | 2025 | 2024 | 2023 |
|---|---|---|---|
| Revenue | 2600 | 2503 | 2295.01 |
| Cost of Material Consumed | 1510 | 1426 | 1002.25 |
| Gross Margins | 43.58 | 43.03 | 56.33 |
| Change in Inventory | -43 | -13 | -23.78 |
| Employee Benefit Expenses | 207 | 183 | 161.83 |
| Other Expenses | 589 | 589 | 890.08 |
| EBITDA | 337 | 318 | 264.63 |
| OPM | 12.96 | 12.7 | 11.53 |
| Other Income | 155.5 | 59 | 7.48 |
| Finance Cost | 12 | 21 | 22.74 |
| D&A | 48 | 44 | 38.69 |
| EBIT | 289 | 274 | 225.94 |
| EBIT Margins | 11.12 | 10.95 | 9.84 |
| PBT | 433 | 311 | 210.67 |
| PBT Margins | 16.65 | 12.43 | 9.18 |
| Tax | 90 | 68 | 52.4 |
| PAT | 343 | 243 | 158.27 |
| NPM | 13.19 | 9.71 | 6.9 |
| EPS | 164.11 | 116.27 | 75.73 |
| Financial Ratios | FY25 | FY24 | FY23 |
|---|---|---|---|
| Operating Margin | 12% | 11% | 10% |
| Net Profit Margin | 13% | 10% | 7% |
| Return on Equity | 29% | 26% | 22% |
| Debt-Equity | 0.09 | 0.17 | 0.36 |
| Current Ratio | 2.36 | 1.66 | 1.4 |
| Dividend Payout | 20% | 24% | 30% |
| Company | TRL Krosaki Refractories Ltd | Vesuvius India Ltd |
|---|---|---|
| Market Cap (₹ Crores) | 4076 | 10615 |
| Profitability Margin (%) | 13.00% | 14.00% |
| ROCE (%) | 23.00% | 26.00% |
| ROE (%) | 29.00% | 19.00% |
| D/E Ratio | 0.09 | 0.01 |
| P/E Ratio | 11.86 | 42.3 |
| P/B Ratio | 3.39 | 6.94 |
| Book Value per Share (₹) | 575.62 | 75 |
Promoters or Management
Annual Reports



Frequently Asked Questions
1. Where are the facilities’ of TRL Krosaki located and what are their capacities?
TRL Krosaki has 6 facilities, Belpahar plant- 2,25,210 MTPA, Salem plant- 14,400 MTPA, TRL Jamshedpur- 30,000 MTPA, TRL MP- 18,000 MTPA, TRL Gujarat- 66,000 MTPA, TRL China- 90,000 MTPA.
2. What is the revenue split of TRL Krosaki?
For the FY 2024, 87.71% of the revenue is from sale of products whereas 11.38% comes from sale of services. Geographically, 87.18% revenue comes from India and rest from export.
3. Who are the clients of TRL Krosaki?
Customers of TRL Krosaki are from various industries such as Iron, Lime, Steel, Aluminium, Power, Copper and Cement industries. They include- Seimens, Tata Steel, Jindal steel and power, JSW steel, JSL, SAIL etc.
Unlisted Market Blogs
Read the latest blogs and trends in the market regarding Unlisted shares